|
Table 5.
Comparative values of Fern and Ganop tests
at the size of follicles from 11 to 17 mm
(n=67)
|
Results |
q |
+ |
++ |
+++ |
Total |
|
|
N |
% |
N |
% |
N |
% |
N |
% |
N |
% |
|
Fern test |
15 |
22.4 |
24 |
35.8 |
18 |
26.9 |
10 |
14.9 |
67 |
100 |
|
Ganop test |
9 |
13.4 |
27 |
40.3 |
18 |
26.9 |
13 |
19.4 |
67 |
100 |
|
X2=1.827;
DF=1; p>0.05 |
Comparative
values of Fern and Ganop tests at the size
of follicles from 11 to 17 mm are shown in
the table 5. The percentage of positive
results was 77.6% (52) in FERN test and
86.6% (58) in GANOP test. There was no
statistically significant difference in the
number of positive results between these two
test (Chi square=1.827; P>0.05).
Table 6.
Comparative values of Fern and Ganop tests
at the size of follicles from 18 to 25mm (n=69)
|
Results |
q |
+ |
++ |
+++ |
Total |
|
|
N |
% |
N |
% |
N |
% |
N |
% |
N |
% |
|
Fern test |
9 |
13.0 |
13 |
18.9 |
22 |
31.9 |
25 |
36.2 |
69 |
100 |
|
Ganop test |
6 |
8.7 |
13 |
18.9 |
23 |
33.3 |
27 |
39.1 |
69 |
100 |
|
X2=0.673;
DF=1; p>0.05 |
Comparative
values of Fern and Ganop tests at the size
of follicles from 18 to 25 mm are shown in
table 6. At this size of the follicle,
FERN test was positive in 87% (60) cases and
GANOP test in 91.3% (63) cases. The
differences are not statistically
significant (Chi square =0.673; P>0.05).
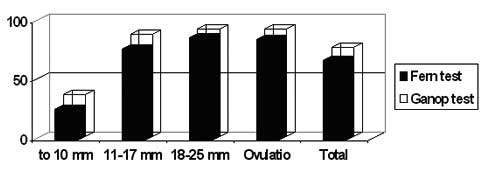
The percentages
of positive results of both tests are shown
in graph 1.
Graph 1.
Percentages of FERN and GANOP tests positive
results according to the size of the
follicle

-
|